Note: Survey items are listed after adding survey files and
selecting one. Initially, only the File menu is active
to allow creation of a new Project
|
Menus |
List of menu controls for managing the survey
data |
File
Menu |
|
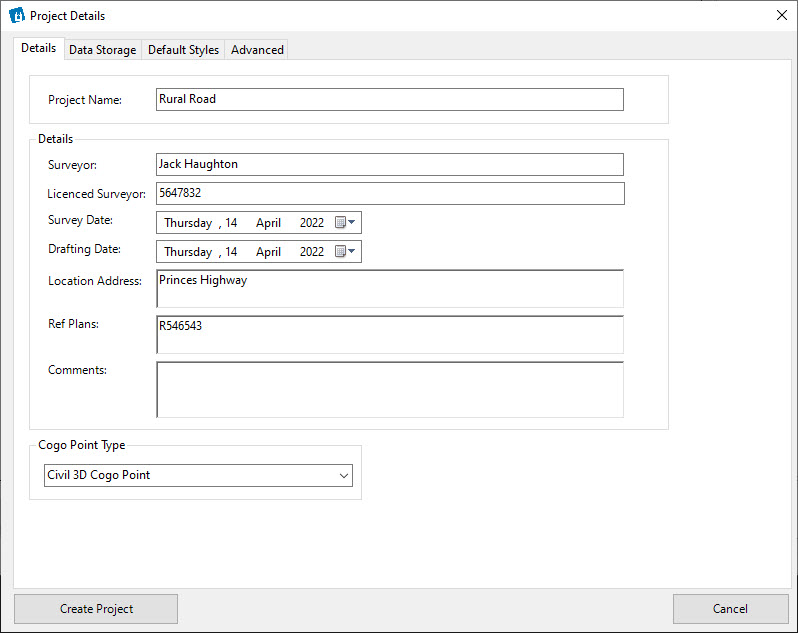
New Project |
Details Tab |
Core setup details for the project |
|
|
Project
Name |
Type
in a Project Name (eg: site identification/purpose) |
Details |
|
Surveyor |
Type
in the surveyor name |
License
Surveyor |
Identification
of the surveyor |
Survey
Date |
Pick
the date of the survey |
Drafting
Date |
Pick
the date of creation of the drawing |
Location
Address |
Type
in the location. Enter can be used
to create multi line text. |
Ref
Plans |
Add
information about any reference plans used. Enter
can be used to create multi line text. |
Comments |
Type
in any comments. Enter can be used
to create multi line text. |
COGO Point Type |
|
Picklist |
Select
the output COGO Point Type
Note: Civil 3D Cogo Point is the default option
for Civil 3D users creating a new project |
|
Data Storage Tab |
Establish how the data folder is
managed for the drawing. Users can pre-set
whether all data is saved inside the drawing when the
drawing is saved or closed as well as where data is stored
during drawing open and editing. |
|
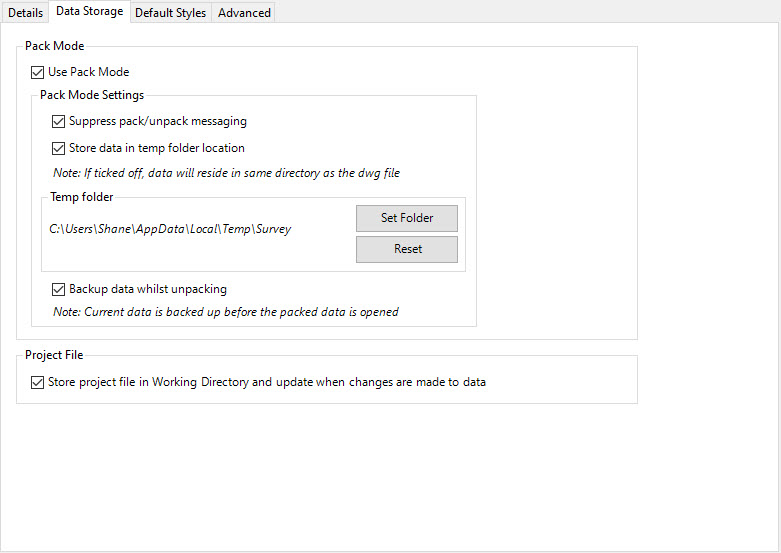
Pack Mode |
|
Use
Pack Mode |
Tick on to enable Pack
Mode (saving of the Data). The term
Data used below means the survey, points, survey
lines, surfaces, Model Viewer display and other
objects created and managed by the software) |
Pack Mode
Settings |
If
'Pack Mode' is enabled for the drawing, these
settings apply |
Suppress
pack/unpack messaging |
By
default, messages are displayed when packing or
unpacking occurs (when the drawing is opened,
saved with a different name/location or closed. |
Store
data in temp folder location |
If ticked on, the Data
is stored in a user specified folder (see Temp
folder). For each drawing, a folder
is added to the 'Temp folder' location and the
Data stored in there. |
Temp Folder |
Control
the location of the Data folder |
Set
Folder |
Click to open a form allowing
the user to set the location of the Data folder. |
Reset |
Sets the default Data folder
to be the current user's Temp folder |
| Backup
data whilst unpacking |
Tick on/off (default on). When
ticked on, a copy of the -Data folder is made
at the time of unpacking the data from the drawing
and zipped.
The file wil be named '<Drawing name>_CSDDataBackup.zip'
and is located in the same folder as the source
drawing. The Data folder is included
in the zip file.
This file is replaced each time the Data is unpacked
from the drawing. |
|
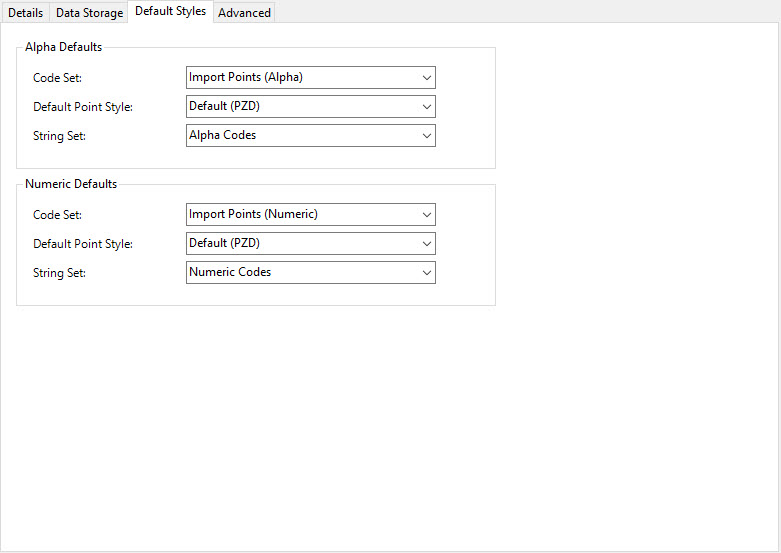
Default Styles Tab |
Establish default Point and Survey
Line Styles to apply, pending whether the survey uses
alpha codes or numeric codes to describe features. |
|
|
Alpha Defaults |
Set the default Code Set
and Survey String (String) Set to apply if alpha
codes are detected. |
Code
Set |
Pick
a Point
Code Set. |
Default
Point Style |
Pick
a default Point
Style. |
String
Set |
Pick
s Survey
Line Set Table. |
Numeric Defaults |
Set the default Code Set
and Survey String (String) Set to apply if numeric
codes are detected. |
Code
Set |
Pick
a Point
Code Set. |
Default
Point Style |
Pick
a default Point
Style. |
String
Set |
Pick
s Survey
Line Set Table. |
|
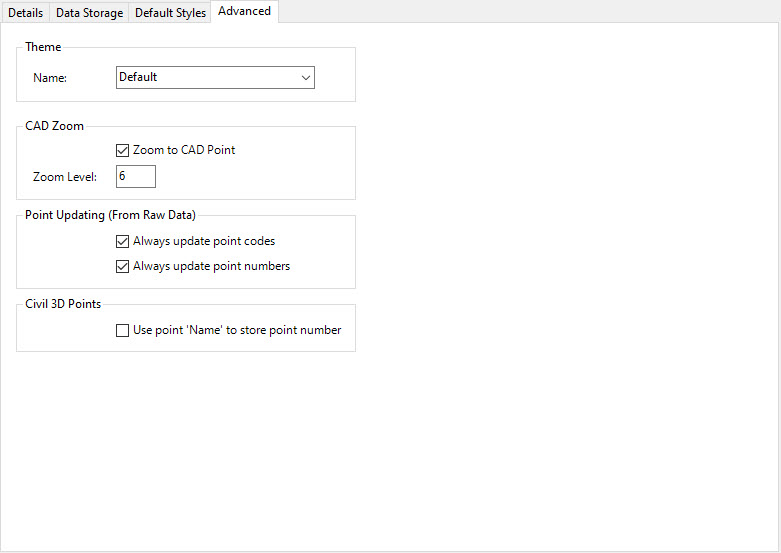
AdvancedTab |
Establish default Point and Survey
Line Styles to apply, pending whether the survey uses
alpha codes or numeric codes to describe features. |
|
|
Theme |
Themes control how each
Survey String is displayed in the Survey View, based
on the survey item type. |
Name |
Pick
a display Theme to apply. |
CAD Zoom |
Choose to auto zoom the
drawing when a survey item is selected in the
Survey View |
Zoom
to CAD Point |
Toggle
on to auto zoom the drawing when a coordinate
or shot is selected in the Survey View |
Zoom
Elevation |
Zoom
factor. Integer input expected. |
Point Updating |
Control whether edits to
the 'raw' data (edits made in the Survey View)
will affect COGO Points previously inserted in
the drawing via this command. |
Always
update point codes |
Changes
to the Code (point description) can update COGO
Points in the drawing |
Always
update point numbers |
Changes
to the point number can update COGO Points in
the drawing |
Civil 3D Points |
Only displayed for Civil
3D users |
Use
point 'Name' |
If
ticked on, when Civil 3D COGO Points are inserted
into the drawing, they will be auto numbered and
the point numbers from the Survey View will be
added to the Civil 3D Point Name. Edits
made using the software will look at the Point
Name and use that for the point number.
Note: This may be required to overcome maximum
point numbers allowed in Civil 3D. |
|
Create
Project |
Creates
a new Project. |
Cancel |
Exit
the form without applying any changes. |
|
Open
Project |
Opens
a previously created Project for editing and insertion of COGO
points in the current drawing |
Save
Project As |
Save
a copy of the project with a different name. |
Project
Settings |
Opens
the same information as the New Project
form. |
Close |
Save
and close the Project. |
Control
Menu |
|
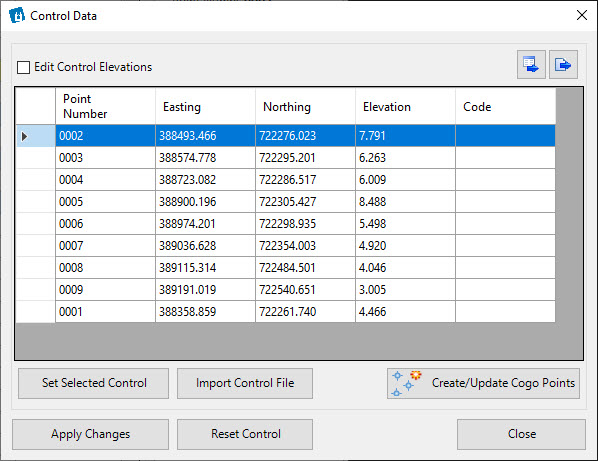
 Control Editor
 |
Opens
a form to manage the Control Points for the selected Survey File.
|
Edit
Control Elevations |
Tick
on to adjust the elevation of control points when importing
or updating by selection from the drawing. |
 Export to table
|
Click
to create a Table in the drawing of the control points |
 Export to file
|
Click
to create a comma delimited text file (.csv) of the control
points |
Control Points Table |
Table listing all Control Points
in the survey file. |
[Various
Items] |
Point
number, easting, northing, elevation and code of each
point is displayed. |
Set
Selected Control |
Dropdown
button offering multiple options to edit Control point
geometry by selection in the drawing |
By Cogo Point |
Before clicking on this command, select
the Control Point to edit.
At the commandline prompt, click in the drawing and then
click on a Stringer COGO Point. The position
of the selected point will be used to set the Control
Point position |
By
Civil 3D Cogo Point |
Before
clicking on this command, select the Control Point to
edit.
At the commandline prompt, click in the drawing and then
click on a Civil 3D COGO Point. The position
of the selected point will be used to set the Control
Point position |
By
CAD Pick |
Before
clicking on this command, select the Control Point to
edit.
At the commandline prompt, click in the drawing and then
click on the desired position. The selected
position coordinates will be used to set the Control Point
Position |
By
Auto (Find Same Point Number) |
Scans
the drawing for point numbers matching the Control Point
numbers in the Control Points Table. Wherever
matching point numbers are found, those Control Point
positions will be updated to match the positions of the
corresponding COGO points in the drawing. |
Import
Control File |
Edit
control point positions by selecting a file to import. After
navigating to and selecting the desired file, the user
will be prompted to select a Point
File Format to match the input file format.
Note: The file must contain matching point numbers to those
in the Control Points Table. |
Create/Update
COGO Points |
The
control points listed in the Control Points Table will
be inserted/updated in the drawing. |
Apply
Changes |
Transfers
edited Control Point positions to the Survey View.
Note: Edited Control Points will be flagged (displayed)
as edited, subject to the Theme applied. |
Reset
Control |
Undo
all edits to all Control Points and restore back to the
original survey file |
Close |
Close
the form. |
Note: Selecting an item in this list will jump to the same
item position in the Survey View panel |
Edit
Menu |
|
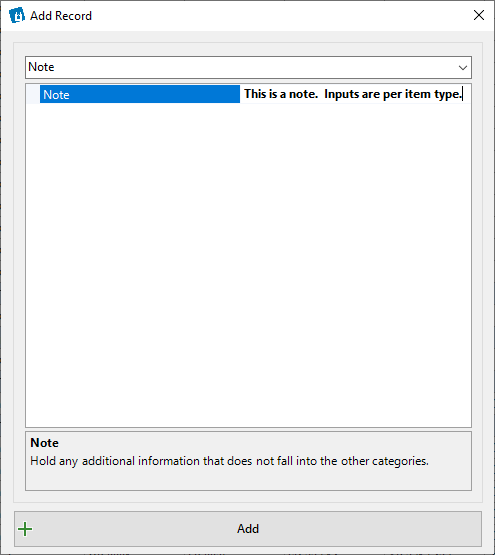
Add
Item |
Adds
a new Item (Survey record) into the Survey View, below the highlighted
row. The following form will display:
|
Type |
Picklist
to select the type of survey record to add:
- Note. This is a general note/detail
in the survey and is not used in the processing of
the data
- Shot. A shot from a control point
- Coord (Control). Acontrol point with
known coordinates
- Prism Correction. A correction to the
prism
- Orient. An orientation shot between
an occupied and observed point.
- Instrument. The instrument and target
height.
|
[Inputs] |
Inputs
will change based on the survey item Type being added. Fill
out inputs as displayed. |
| Add |
Adds
the new item into the Survey View list, below the highlighted
item. |
|
Search
and Replace |
Opens
the following form:
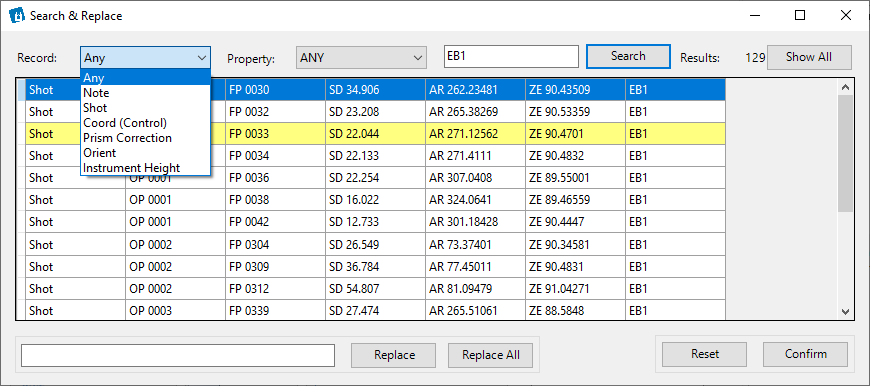
Use the 'Record' and 'Property' dropdowns to filter
the search to specific input types (eg: Shot) and/or certain
specific inputs (eg: Code) |
Record |
Picklist
to filter the search to specific types of survey items. Select
'Any' to reset this filter. |
Property |
Picklist
to filder the search to a specific input (such as the
Code or Point Number). Select 'Any' to reset
this filter. |
[Input] |
Type
in a text string to search for |
Search |
Click
to search and display a list of survey items matching
the search and filter criteria. |
| Results |
Non-editable
field displaying the number of records matching the search
and filter criteria. |
| Show
All |
Shows
all records. |
Search
Results List
[List of Items] |
Displays
the list of items (records) that matched the serach and
filter criteria.
These are non-editable, except via the Replace button. |
Replace |
Replace items searched for.
Note: Replacement of the highlighted entries in the
search results list uses the inputs of the Search box
(including the filter selections) to execute the replacement. |
[Input] |
Type
in a replacement for the searched record/property. |
Replace |
Replaces
the the items highlighted in the Search Results List |
| Replace
All |
Replaces
all items in the Search Results List. |
Reset |
Undo
changes made in this search and replace action |
| Confirm |
Send
the changes back to the Survey View Panel and apply the
changes. |
Note: Selecting an item in this list will jump to the same
item position in the Survey View panel |
Reset
All Items |
This
will undo all edits to the survey, including removal of any added
data (restores back to the state of the original survey file). |
View
Menu |
|
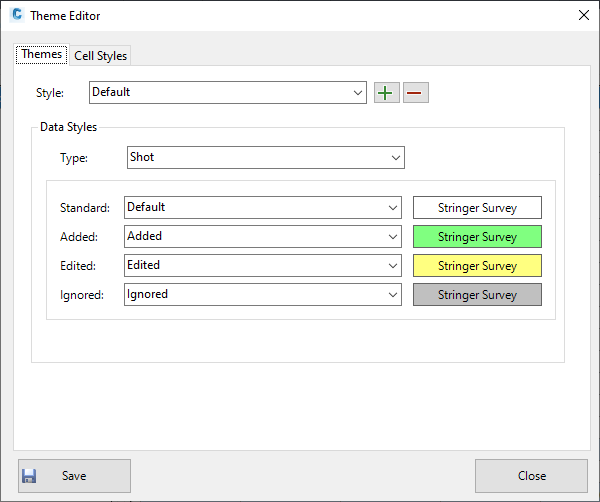
 Theme Editor
 |
|
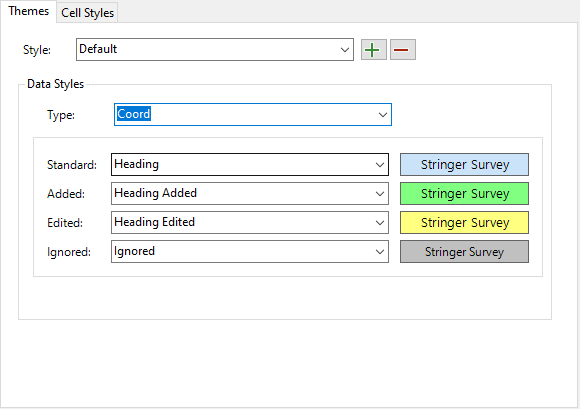
Themes Tab |
Create a 'Theme' (mode of display)
and for each Data Type, set the Cell Style to display
the type pending the edit status (Standard/Original, Added,
Edited, Ignored) |
|
|
Style |
Pick
a named Theme to edit. |
Add
New |
Click
on the + to create a new Theme. A form
will display to name and save the Theme. |
Delete
Current |
Click
on the - to create a delete the currently selected
Theme. |
Data Styles |
Pick the Survey item Type,
then the display to apply based on the status
of the entry |
Type |
Select
the Survey item Type using the picklist.
Edits below apply to the selected Survey item Type. |
Standard |
Pick
a Cell Style to manage the display of standard
(as imported) items |
Added |
Pick
a Cell Style to manage the display of added items |
Edited |
Pick
a Cell Style to manage the display of edited items |
Ignored |
Pick
a Cell Style to manage the display of ignored
(removed from output) items |
|
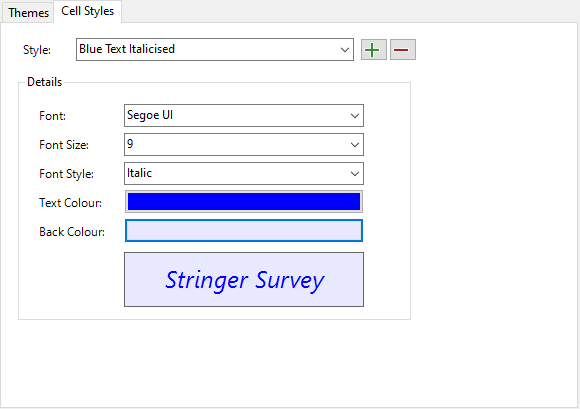
Cell Styles Tab |
Cell Styles are used to manage the
display of items in the Survey View panel. |
|
|
Style |
Pick
a named Cell Style to edit. |
Add
New |
Click
on the + to create a new Cell Style. A
form will display to name and save the Cell Style. |
Delete
Current |
Click
on the - to create a delete the currently selected
Cell Style. |
Details |
Sets the way the font and
the cell will display if the Cell Style is used
in the current Theme |
Font |
Pick
the text font |
Font
Size |
Pick
a font size |
Font
Style |
Select
the formatting: Regular, Bold,
Italic, strikethrough |
Text
Color |
Pick
a color. A form will display for the
user to select the color |
Back
Color |
Sets
the background color for the cell. A
form will display for the user to select the color |
| Preview |
A
preview of the font setup will display to indicate
the representation when applied. |
|
Save |
Save
the changes and continue editing. |
| Close |
User
is prompted whether to save and exit, or just exit. |
|
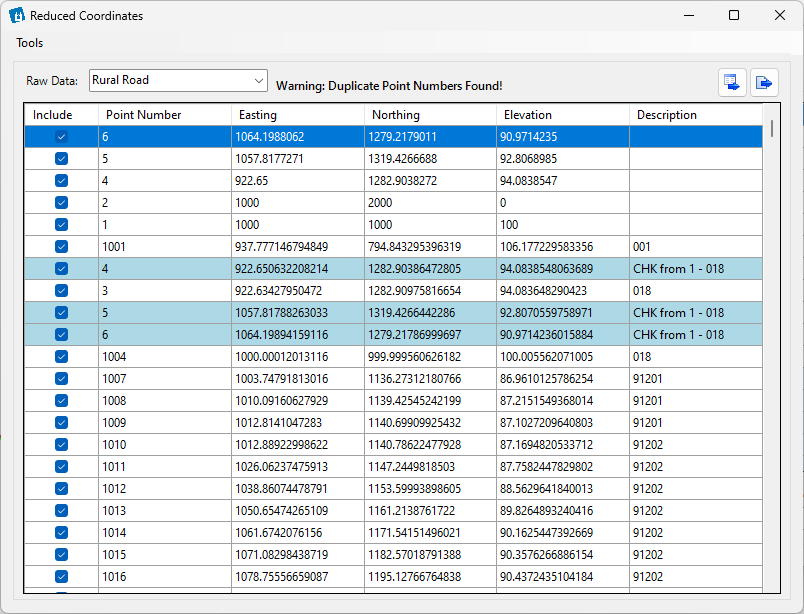
 Reduced Coordinates
 |
Displays
the reduced coordinates (x,y,z) from the current survey
items. Each Survey File (Raw Data) can be selected
for viewing:
|
Tools Menu |
Lists different options for including/excluding points from
being added to the drawing |
Include Selected |
Tick on the highlighted rows to include in output to drawing |
Exclude Selected |
Untick the highlighted rows to exclude from output to drawing |
Include by Point Number Range |
Type in a point number range to include those points for output
to the drawing |
Exclude by Pont Number Range |
Type in a point number range to exclude those ponits from output
to the drawing |
Include by Elevation Range |
Type in an elevation range to include thos points for output to
the drawing |
Exclude by Elevation Range |
Type in an elevation range to exclude those points from output
to the drawing |
|
Include by Polyline |
Click on a closed polyline in the drawing to set points within
that area to be included for output to the drawing |
|
Exclude by Polyline |
Click on a closed polyline in the drawing to set points withint
that area to be excluded from output to the drawing |
Output Convex Hull |
Creates a closed polyline around the point extents. |
Raw
Data |
Pick
an added Survey File to view the coordinates. |
|
If
duplicate point numbers are found a warning will display
and duplicate numbers will be highlighted with a blue
background. |
Export to table |
Click
to create a Table in the drawing |
Export to file |
Click
to create a comma delimited text file (.csv) |
Reduced Coordinates
[List of Items] |
The Include cell can be toggled to include
(ticked) or exclude (unticked) each observed point from being
created in the drawing as a COGO point.
Other display columns include Point Number,Easting, Northing,
Elevation and Description from the survey data.
These cells are non-editable.
Clicking on a cell will jump to the source entry in the
Survey View Panel, and in the drawing if the points have
been inserted. |
|
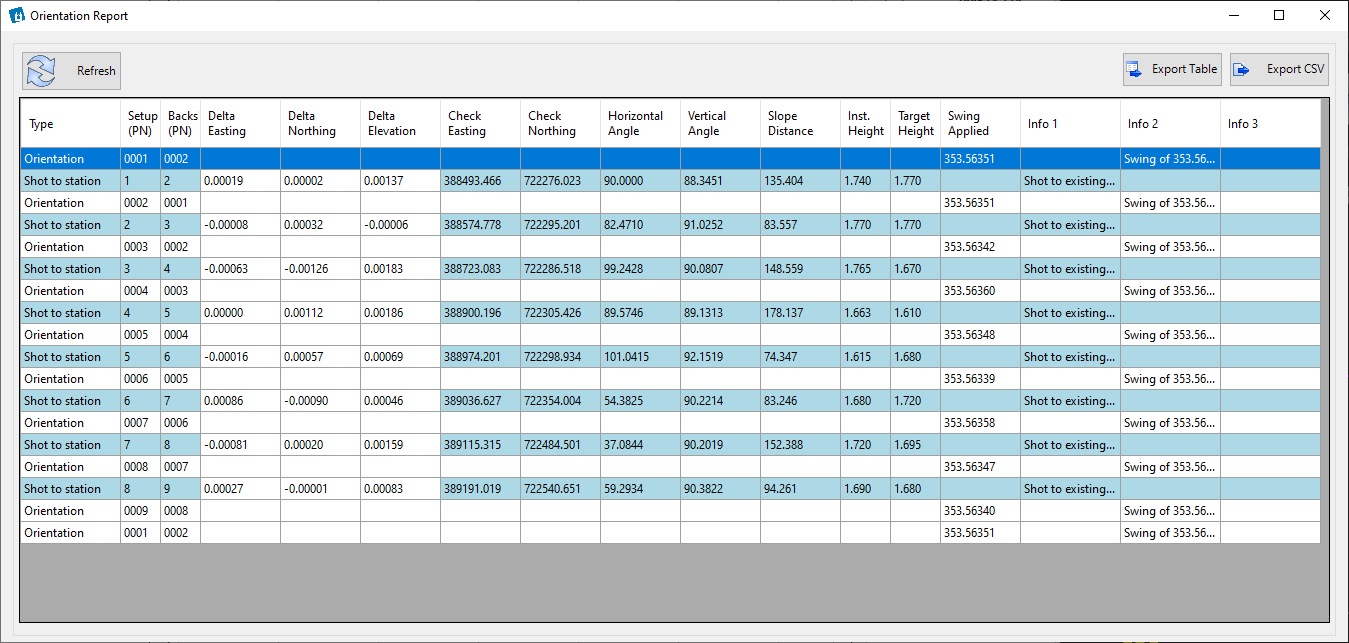
 Orientation Report Orientation Report |
The
orientation report details the accuracy of backsights
(orientations)
|
Refresh |
If
the data has been edited while this form is open, clicking
this button will update the contents |
Export to table |
Click
to create a Table in the drawing |
Export to file |
Click
to create a comma delimited text file (.csv) |
Orientation
Details
[List of Items] |
Describes
each orientation and shot to station.
The Delta Easting, Delta Northing and Delta Elevation will
be highlighted with a pick background if outside of tolerance,
and otherwise shown with a white background.
The 'shot to station' contents will otherwise be highlighted
with a blue background. |
|
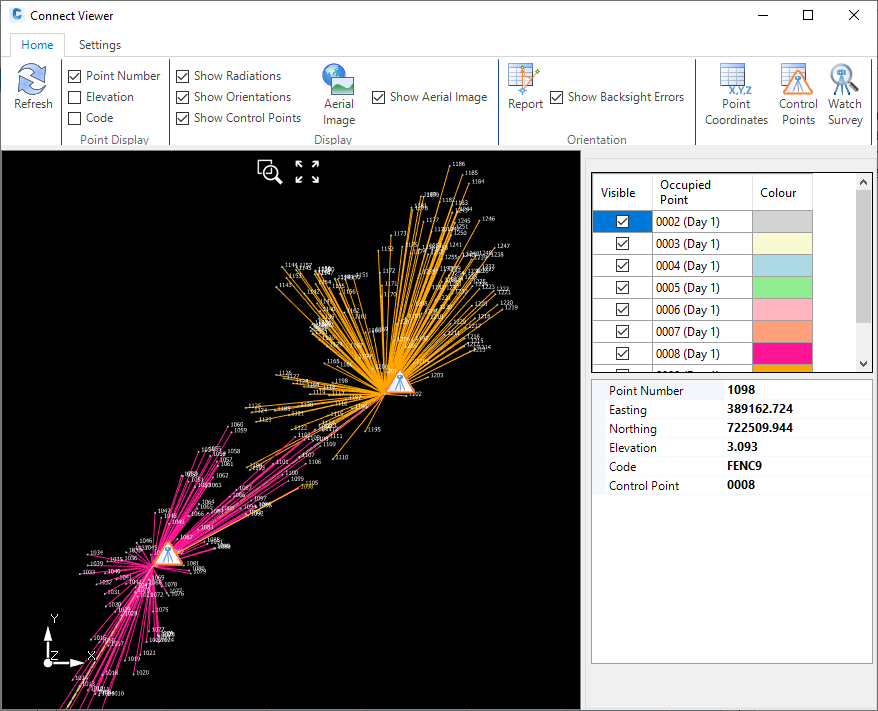
 2D Viewer 2D Viewer |
A
new window (form) will display showing a plan of the survey
highlighting control points, radiations, shots (points),
orientations, shots to existing stations and backsight
errors.
Radiations are automatically assigned a color based
on the Occupied Point from which the radiation orginates. Users
can edit the colors as well as turn of collections of
raditations (by turning off the Occupied Point) from the
top right panel.
The bottom right panel displays the details of the item
selected in the 2D viewer: radiation, shot, control point,
orientation or shot to existing station.
|
Home Tab |
|
Refresh |
If
the survey data has been edited, pressing this button
will update the 2D viewer. |
Point
Display Panel |
Control what information displays
for the shots (points).
Note: Point information text will auto resize to improve
legibility, unless disabled in the Settings |
Point
Number |
Toggle
on/off display of the point number |
Elevation |
Toggle
on/off display of the point elevation |
Code |
Toggle
on/off display of the point code (description) |
Display
Panel |
Control the display of radiation
lines, orientation lines, control points and a background
image. |
Show
Radiations |
Toggle
on/off display of the radiation lines to each shot (coloured
per Occupied Point) |
Show
Orientations |
Toggle
on/off display of the orientations (and shots to existing
stations) |
Show
Control Points |
Toggle
on/off display of the control points.
Control points are highlighted in the 2D viewer with this
symbol:
 |
Aerial
Image |
After
clicking on this button, click in the drawing and then
click to select an image (.bmp, .png, .jpg) to display
it as a background in the 2D viewer |
Show
Aerial Image |
Toggle
on/off display of a selected background image. |
Orientation
Panel |
Highlight backsight errors in the
2D viewer and view an orientation report. |
Report |
Opens
the Orientation Report
form. |
Show
Backsight Errors |
Toggle
on/off display of backsight errors (backsights that are
outside tolerance)
Backsight errors are highlighted in the 2D viewer with
this symbol and the point will be highlighed with a red
circle:

Note: the Backsight tolerance is controlled from the
Settings Tab in the 2D viewer)
|
Point
Coordinates |
Opens
the Reduced Coordinates
form. |
Point
Coordinates |
Opens
the Control Editor form. |
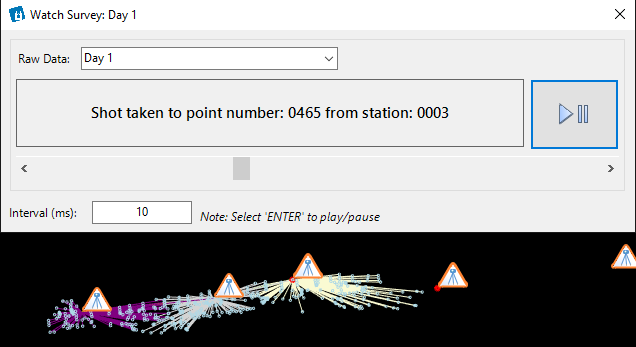
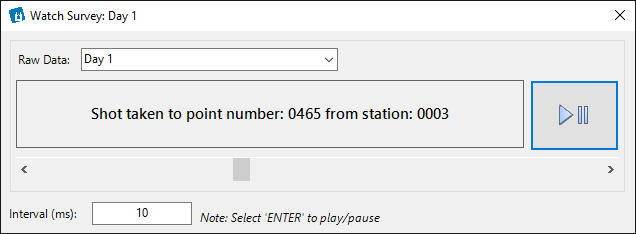
Watch
Survey |
Allows
users to 'walk through' the survey as it was picked up
in the field. See the progress of the survey
from first to last point. The following form
will diplay:
|
Raw
Data |
Pick
an added Survey File to view the progression of
that survey. |
| Information
Panel |
Panel
displaying the current action in the survey. |
| Play
button |
Click
to animate (step through each action in) the survey,
at the time Interval specified.
Note: Press ENTER to pause and restart the
animation of the survey |
| Slider
Bar |
Click
on and drag the grey box to jump to any 'time'
in the survey.
Click on the < or > arrows to step to the
next point in the survey. |
Interval
(ms) |
Type
in an integer for the time interval between survey
actions (in milliseconds). |
|
Settings Tab |
|
Settings Panel |
Sets the background color and auto
text resizing of the 2D viewer window |
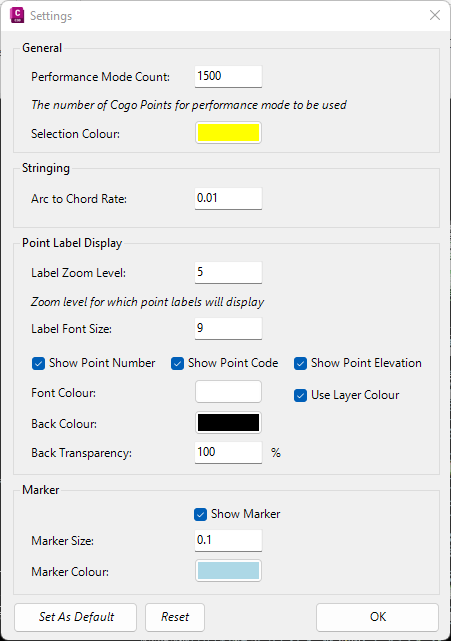
Settings |
Establishes display and performance settings for the Survey Line
Manager. The following form will display:
|
General |
|
Performance Mode Count |
Sets the number of points in the drawing to trigger display
performance mode. Performance mode changes anti aliasing
and quality of label redisplay. |
Select Color |
Sets the color used to display selected objects in the Survey
String Manager and 2D Viewer windows. |
Stringing |
|
Arc to Chord Rate |
Type in a value for the offset distance between a true arc
between points and the chords around that arc. Chords are
created to support surface triangulations. |
| Point Label Display |
|
Label Zoom Elevation |
Not used in the 2D Viewer |
Label Font Size |
Type in a value (in pixels) to display the point label text |
Show Point Number |
Tick on to display the Point Number as part of the point
labeling in the Survey String Manager form |
Show Point Code |
Tick on to display the Point Code as part of the point labeling
in the Survey String Manager form |
Show Point Elevation |
Tick on to display the Point Elevation as part of the point
labeling in the Survey String Manager form |
Font Color |
Pick a font color for the point labels |
Use Layer Color |
Not used in the 2D viewer |
Back Color |
Optional background color to apply behind each point label -
this i represented by a rectangle behind the text |
Back Transparency |
Type in a value between 0 (opaque) and 100 (fully transparent)
to display the Back Color |
| Marker |
|
Show Marker |
Tick on to display a marker for each Point |
Marker Size |
Type in an integer value for the size of the marker |
Marker Coolour |
Set a coluour to use for display of the point marker. |
Set as Default |
Edits made in this form are for the current drawing. Click on
this button to assign these settings to all future jobs. |
|
Reset |
Resets this form to adopt the Default settings for all inputs. |
OK |
Create the Survey Strings |
|
Background
Color |
Click
to pick a color for the background |
Orientation
Lines Color Panel |
Set colors for the different orientations |
Orientation |
Click
to pick a color for the orientation lines. These
display as dashed lines |
Shot
to Station |
Click
to pick a color for the shots to stations. These
dsplyay as dashed lines. |
Shot
to Known Point |
Click
to pick a color for the shots to known points. |
Shot
to Observation |
Click
to pick a color for the shots to observations. |
Tolerances |
Set the tolerances to highlight
backsights as being in error. |
Backsight
Check |
Type
in an error distance |
Refresh Check |
Update
the 2D Viewer if the Backsight Check
is changed. |
Display Window |
|
| |
This
is where the survey is displayed graphically.
Click on an item to highlight it in the display window,
display the details in the bottom right panel and jump
to the entry in the Survey View panel. |
Occupied Point Controls |
Top right panel |
| [List
of Controls] |
Manage
display of radiations from occupied points |
Visible |
Tick
visibility of radiations from the occupied point |
Occupied
Point |
Lists
the occupied point number and, in brackets, the Survey
file it originates from. |
Color |
Click
to pick a color for the radiations. |
Selected Item Details |
bottom right panel |
| [Listed
Details] |
When
an item is selected in the 2D viewer, this panel displays
the inputs for the item.
This is a dynamic dispaly - the inputs will change pending
the type of item selected. |
|
 Code Report
 |
Starts
the Code Report command. |
Settings
Menu |
|
Store
Check Coords |
Tick
on to store check coordinates.> |
Curvature
correction |
Tick
on to apply curvature correction |
Collate
Observations |
Tick
on to collate observations |
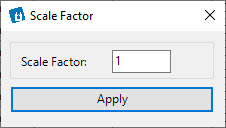
Set
Scale Factor |
After
clicking on this option a form will display to apply a scale factor.
|
Scale
Factor |
Type
in a value. Default is 1 (no scaling) |
Apply |
Click
to set the scale factor |
This scale factor will apply to all shots, when COGO points are
added to the drawing or the 2D viewer is displayed. The
Survey view will not update distance information. |
Utilities
Menu |
|
Increment
Point Numbers |
Options to add/subtract to the point numbers
in the survey data |
All |
This
will increment all points.
A message will display to confirm the action. After
clicking Yes the following form displays:
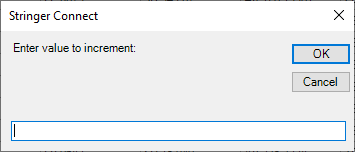
|
Enter
Value to Increment |
Type
an integer to append this value to the current point numbers
in the survey. |
OK |
Apply
and exit. |
Cancel |
Exit
the form without change. |
|
Control
Only |
This
will increment the Control Points only. Shots will
be edited to maintain connection with the correct occupied point.
A message will display to confirm the action. After
clicking Yes the following form displays:
|
Enter
Value to Increment |
Type
an integer to append this value to the current point numbers. |
OK |
Apply
and exit. |
Cancel |
Exit
the form without change. |
|
Shots
Only |
This
will increment the Shots only.
A message will display to confirm the action. After
clicking Yes the following form displays:
|
Enter
Value to Increment |
Type
an integer to append this value to the current point numbers. |
OK |
Apply
and exit. |
Cancel |
Exit
the form without change. |
|
Remove
Duplicate Point Numbers (Shots) |
This
will find all Shots that duplicate other points and automatically
renumber these to resolve duplicate numbers.
A message will display to confirm the action. After
clicking Yes any duplicate Shots will be renumbered automatically
using the next available number. |
Remove
Spaces from Codes |
Click
to remove all spaces in the Point Descriptions (raw Codes).
NOT recommended if multiple coding is added to points, where the
Space is a delimiter between Codes |
Set
All Codes to UpperCase |
Sets
all Point Descriptions (raw Codes) to display UPPERCASE |
Swap
BC <> BS |
Swaps
bearings. A message will display to confirm the action. |
Leica
Code Fix |
This
command removes descriptive text that could be added to the Code,
for Leica equipment. |
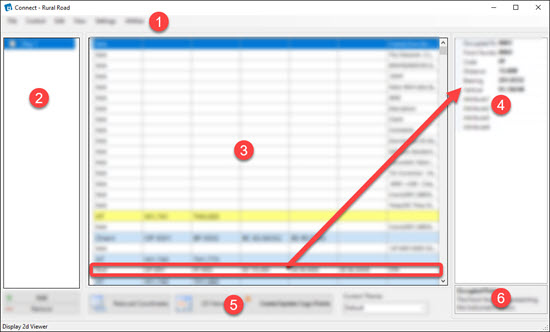
Survey Files Panel |
(Left Side Panel) Displays all added survey
files. |
[List
of Surveys] |
All
added Survey files are listed here.
Click on a Survey to display it in the Survey View panel for review
and edit |
Add |
Click
on this button to add a Survey file to the Project. The
following form will display:
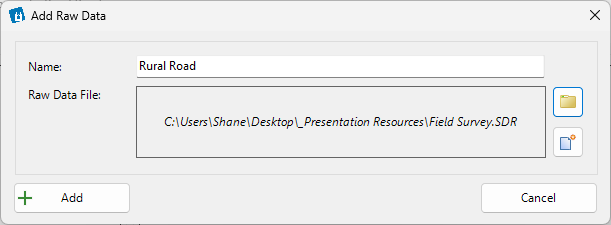
|
Name |
Type
in a name for the survey file (eg: Day #) |
Raw
Data File |
Lists
the path to the selected raw data file |
 Open Data File Open Data File |
Click
to open a form to navigate to and open a raw data file.
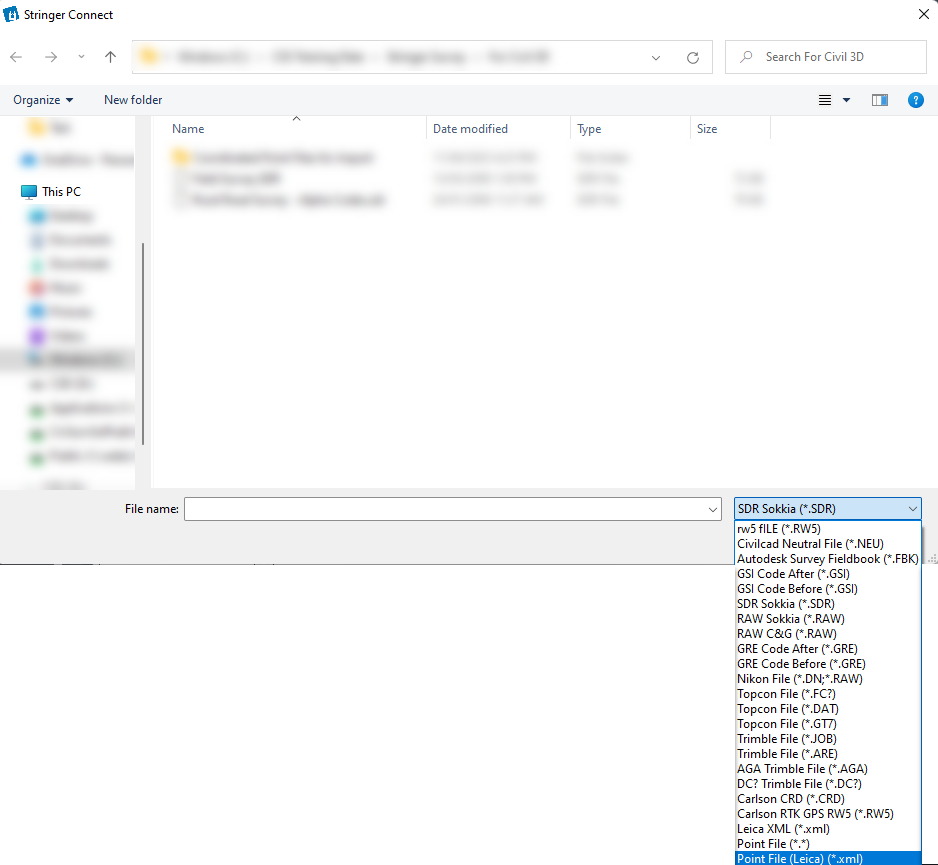
|
File
Type |
Pick
the file type (bottom right) for the raw data
file output from the survey equipment |
File
Name |
Pick
the file from the navigation panel to populate
the File name. |
Open |
Open
the file and add it. |
Cancel |
Cancel
adding the file |
|
 Create New
 |
Accept the prompt to create a new file. Select a file
location, type in a name and select the type (.sdr only)
|
Add |
Add
the Survey file to the Project. |
Cancel |
Exit
without adding a Survey file. |
|
Remove |
Removes
the highlighted Survey file |
[List
of Surveys] |
All
added Survey files are listed here.
Click on a Survey to display it in the Survey View panel for review
and edit |
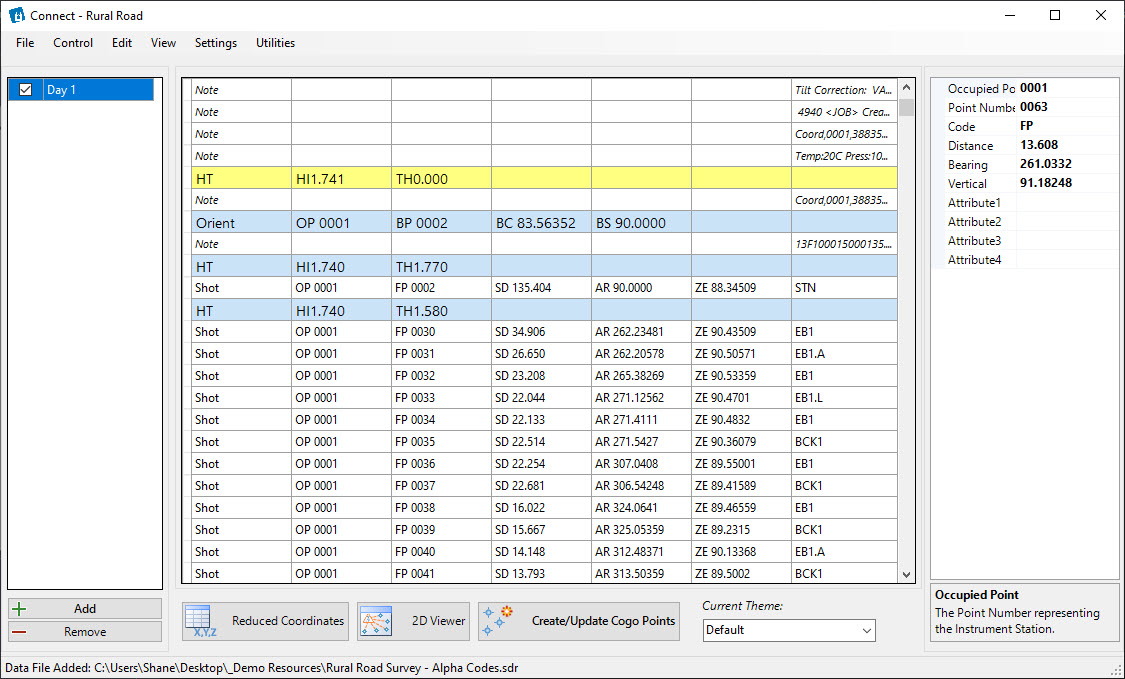
Survey View Panel |
(Mid Panel) Displays all added survey files. |
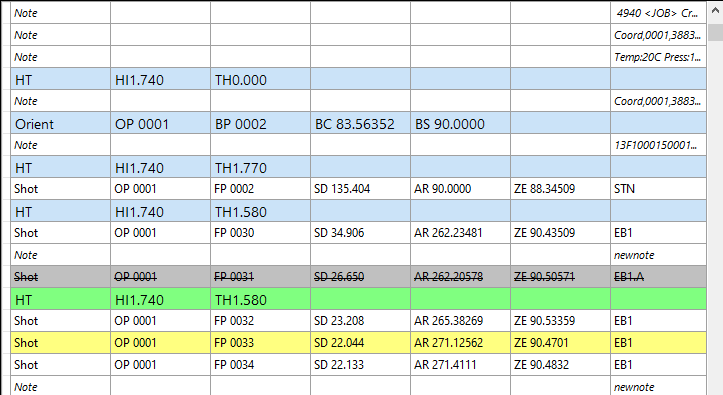
[List
of Survey Items] |
This
lists each survey item, differentiated by the survey entry type
and edit status, as per the selected Theme.
Columns contain different information relevant to the item type. Two
letters are placed ahead of the value to indicate the input type
(such as HI for Instrument Height, TH for Target Height, OP for
Occupied Point).
Left click on an entry to zoom to the point in the drawing (if
points have been created from the survey data) and display the
details for that entry in the Right Side Panel.
Right click on an entry to access a shortcut menu of options:
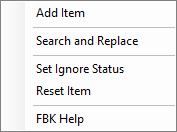
|
Add
Item |
Adds
a new survey entry below the selected item via the Add Item form. |
Search
and Replace |
Opens
the Search and Replace
form. |
| Set
Ignore Status |
Toggles
the item to be included or excluded from the survey reduction |
| Reset
Item |
If
the item has been edited, this will restore it to the
original conditions (as per the source survey file) |
| FBK
Help |
Displays
information about pickup using the Fieldbook (FBK) format. |
|
Survey Item Editor Panel |
(Right Side Panel) Displays contents of
the selected entry in the Survey View list for direct editing. |
[List
of Inputs] |
When
an item is selected in the Survey View list, this panel displays
the inputs for the item.
This is a dynamic dispaly - the inputs will change pending the
type of item selected.
Each value can be edited by typing into the input in the second
column. Press ENTER or click on a different cell to
apply the change. |
Core Function Buttons |
|
Reduced Coordinates |
Opens
the Reduced Coordinates form. |
2D Viewer |
Opens
the 2D Viewer form. |
 Create/Update Cogo Points
 |
Converts
the survey data into coordinated point data and adds the COGO
Points to the drawing.
If points have previously been created, this will update the
COGO points in the drawing (pending the Project Settings)
If no points have been created in the drawing from this survey
data, the user will be prompted to manage the creation of the
COGO Points and Survey Strings.
Note: The form display is different for Civil 3D customers. Note
both processes are shown below.
NON-Civil
3D Users |
Below
is the process for initially creating points in the drawing
for non-Civil
3D users. |
The
following form will display:
|
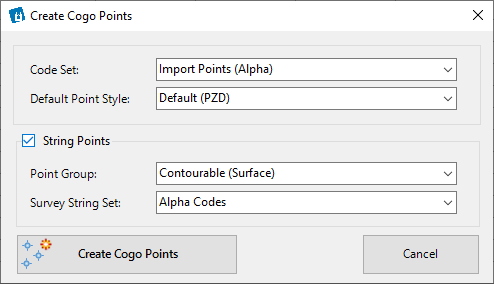
COGO Point Creation |
|
Code
Set |
Select
the Point Code
Set to use to display the points and manage the Code
information contained in the raw description. |
Default
Point Style |
Select
a Point Style
to use to display points that are not managed via the
Point Code Set. |
Survey String Creation |
|
String
Points |
If
ticked on, Survey Strings will be created connecting points
based on the Point Description. |
Point
Groups |
Select
a Point Group
to use for creating Survey Strings. |
Survey
String Set |
Select
a Survey
Line Set Table to use for creating Survey Strings. |
Create
Cogo Points |
Creates
COGO points in teh drawing |
Cancel |
Exit
without adding points. |
Civil
3D Users |
Below
is the process for initially creating points in the drawing
for Civil 3D
users. |
The
following form will display:
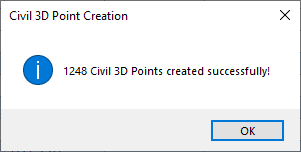
Civil 3D points have been added to the drawing, displayed
based on the Point Groups and Civil 3D Description Key
Set/s. Click OK to proceed.
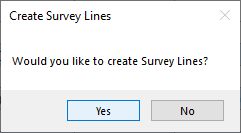
The following form will display:
|
Yes |
After
clicking Yes to create Survey Strings, the following form
is displayed:
|
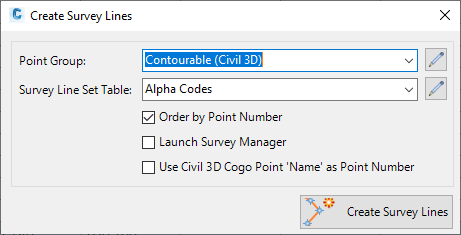
Point
Group |
Select
the Civil 3D Point Group.
Note: This will also establish a link between
the Civil 3D Point Group and Stringer Survey,
so that Stringer Survey can make edits to the
Civil 3D Points |
Survey
Line Set Table |
Select
a Survey
Line Set Table to use for creating Survey
Lines. |
Order
by Point Number |
Initially
Survey Strings will be created by joining like points
in sequential point number order. |
| Launch
Survey Manager |
Will
open the Survey
Line Manager form to facilitate review and
editing of the Survey Strings. |
Use
Civil 3D COGO Point 'Name' as Point Number |
The
Civil 3D Point Name field will be scanned for
the point numbers to use to connect Survey Strings.
If toggled on, edits to points made using Stringer
Survey will change the Civil 3D Point Name for
each Civil 3D point.
Important Note: The Civil
3D points need to be set up so teh Point Name
contains the desired point numbers. This
can be set up in the Project Settings form. |
Create
Survey Strings |
Click
to create Survey Strings in the drawing. |
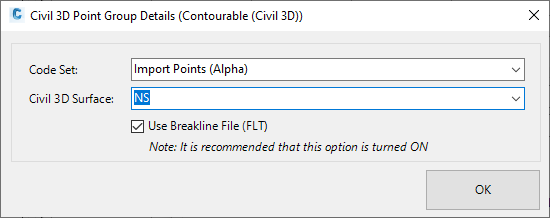
In order to add the Survey Strings as breaklines to the surface,
the following form will display:
|
Code
Set |
Pick
the Point
Code Set to use. |
Civil
3D Surface |
Pick
the Civil 3D surface to add the Survey Strings to
as Breaklines |
Use
Breakline File (FLT) |
Tick
on to add all Breaklines to the surface via file. This
is the fastest method to add breaklines to a surface
and update.
Untick to add each Breakline individually to the
surface. When unticked, each Breakline
will be named individually for the surface. |
| OK |
Create
the breaklines for the Civil 3D surface and establish
a link betwen the Civil 3D points, Stringer Survey
and the surface breaklines. |
|
No |
The
form closes and the user is returned to this Import and
Reduce form. |
|
Cancel |
Exit
the form without deleting any data. |