Table Styles


Icon:
   
Ribbon:   Survey Tab > Outputs Panel > Table Styles
 

Introduction

Group Tables allow the creation of a report or table describing points and survey strings used in the drawing.

Multiple properties are available to include in a Table.  The Table Style allows the user to confirgure what a Table should display for the points and survey strings used in the drawing.

This form allows the user to create Table Styles to manage the table output to the drawing.

Table Styles are saved to the Settings folder and can be applied to any project.

Table Style Controls

This command controls all display elements of the Table that is created in the drawing, with four tabs managing the different display elements:
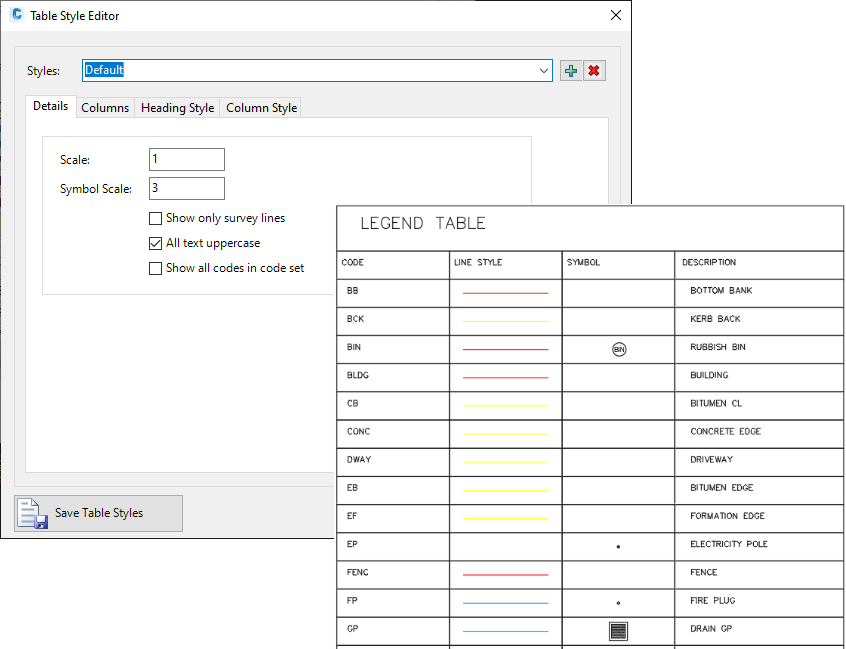
Details
Sets overall scale, size of the Symbols (point styles) and other overall controls.
2 Columns
Establishes what information is displayed for each column, as well as the column headings and the width of each column
3 Heading Style
Sets the row height, text style, layer, text height, text alignment and linework layer for the Heading row
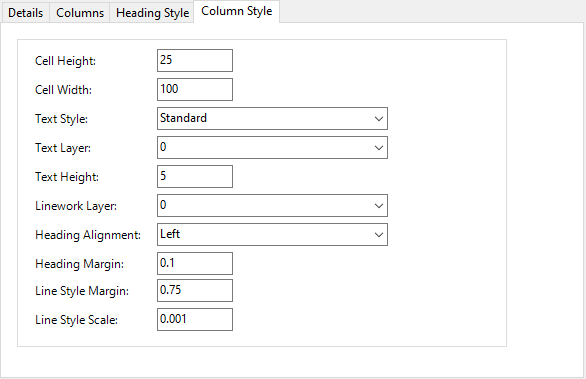
4 Column Style
Sets the row height, text style, leyer, text hight, text alignment and linework layer for the data rows.
Sets the Survey String controls - line style margin (line length equals the column width, minus the 'margin' left and right) and line style scale


Details

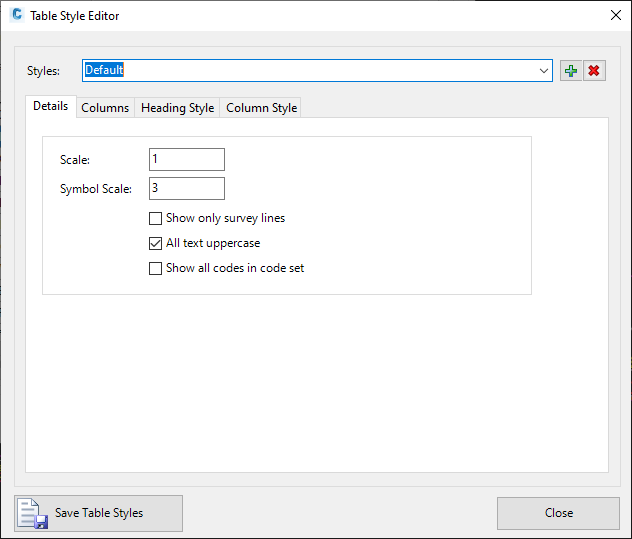
Upon selecting the command the following form is displayed:


Style

Select a Table Style from the picklist to edit

Add Style

Click to add a new Table Style.  A form will display for naming and creating the Table Style.

Remove Style

Deletes the selected Table Style

Details Tab

See below

Columns Tab

See below
Heading Styles Tab See below

Column Styles Tab

See below

Save Table Styles

Save all edits made to Table Styles.  Form does not close.

Close

Close the form


Details Tab


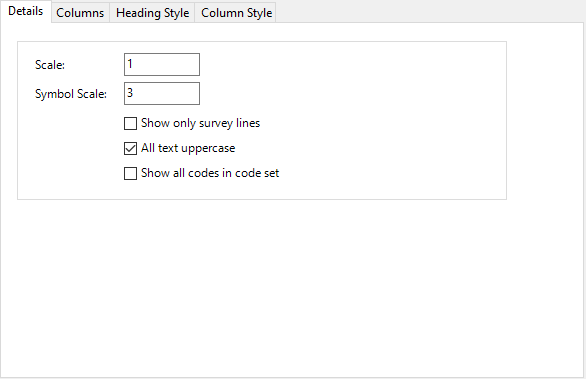
Scale

Sets the overall scale of the table

Symbol Scale

Sets the scale of symbols (blocks) shown for each Code. 

Show only Survey Strings

If ticked on, only Codes that contain Survey Strings will be shown.
All text uppercase Show all text UPPERCASE
Show all codes in Code set If toggled on, every Code as described in the Point Code Set will be displayed.  Otherwise, only the codes used will be displayed


Columns Tab


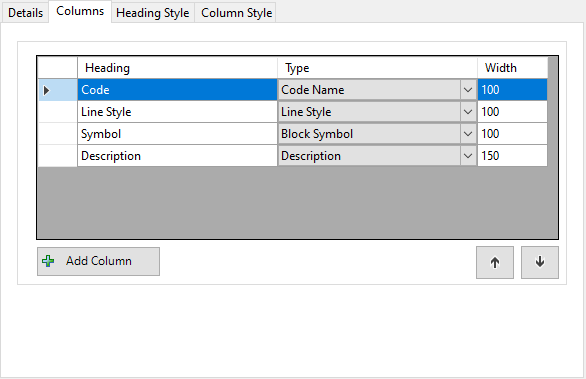
Set up the columns of information to include in the table

Table > Pick First column is a column selection by click

Heading

Type in a heading for the column
Type Cick a property to include in the column. Options include display of symbols, survey lines, and point and string information.
Width Column width
Add Column Click to add a new column to the right (added to the bottom of the list)
Up Arrow Move selected entry up in the list, to move the column left in the table output
Down Arrow Move selected entry down in the list, to move the column right in the table


Heading Style (Table Title Style) Tab


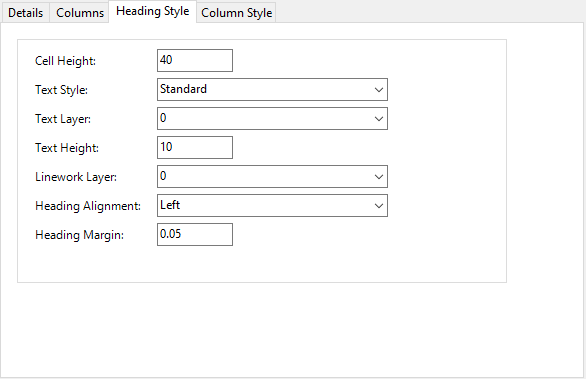
Sets the overall heading row (Table Title) display including text size, style, justification and border layer.

Cell height Row height for the heading
Text Style Set the text style to be used for the heading text
Text Layer Pick a layer for the text
Text Height Type in a height for the text
Linework Layer Set a layer for the table border
Heading Alignment Text position in the table: left, middle, right
Heading Margin Offset of text from the borders


Column Style Tab


Sets the display of each column including the header of each column

Cell height Row height for the heading
Cell Width Width of each column
Text Style Set the text style to be used for the heading text
Text Layer Pick a layer for the display text in the columns
Text Height Type in a height for the text
Linework Layer Set a layer for the table border
Heading Alignment Text position for the heading of each column: left, middle, right
Heading Margin Offset of text from the borders
Line Style Margin If a survey line is shown, offset of the line start/end from the left/right border of the column
Line Style Scale Scale to draw the survey sample line