Quick Section
Icon: |
|
Introduction
Creates dynamic cross-sections along a selected polyline, displaying multiple data sources (surfaces, models, sub-models, survey strings, and pipe networks) in an interactive 2D viewer. This allows engineers to visualise and analyse vertical profiles of the design.
Usage Workflow
1. Select Polyline: Click the "Select Polyline" button and choose a polyline in the drawing. The section line is established.
2. Configure Display: Check/uncheck surfaces, models, and sub-models. Select a point group if COGO points are desired.
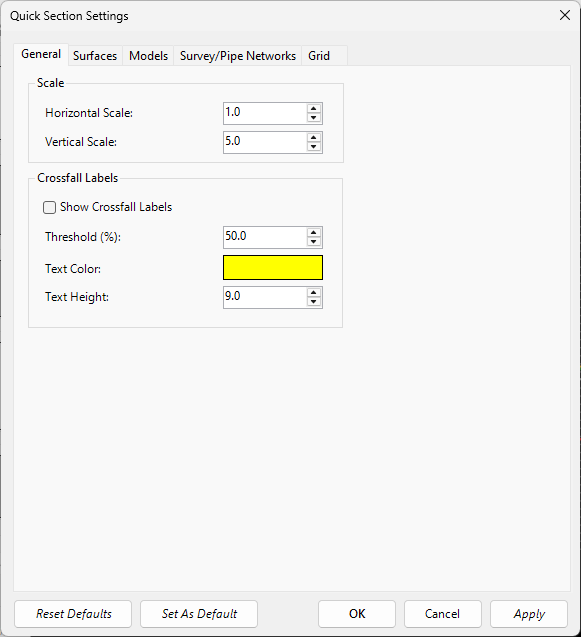
3. Adjust Settings (Optional): Click "Settings" to modify scale factors, grid intervals, and line weights.
4. Generate Section: Click "Refresh" or allow auto-updates to calculate and display the section in the 2D viewer.
5. Export (Optional): Click "Draw in CAD" to export the section geometry to the drawing on separate layers.
Best Practices
For Large Projects: Use simpler display settings, limit displayed elements, use surface caching, and increase grid intervals.
For Detailed Sections: Increase sampling density, use higher line weights, enable all data sources, and decrease grid intervals.
For Presentations: Use high-contrast colours, add annotations, save view settings, and export to CAD.
Details
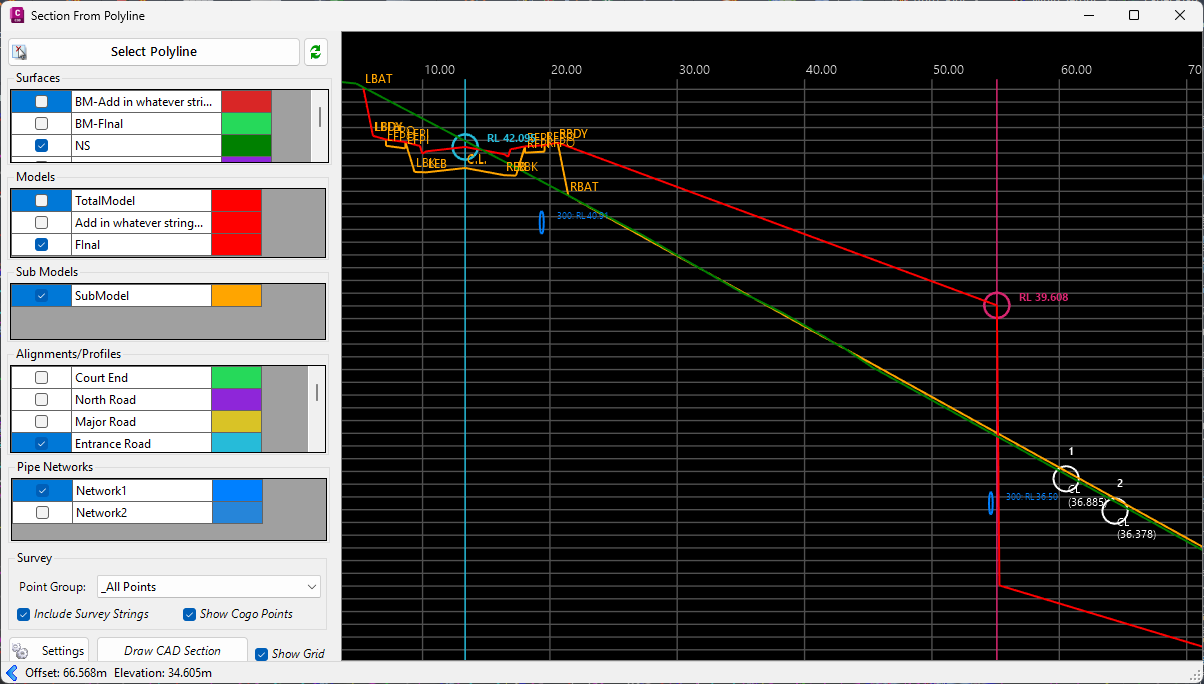
Upon selecting the command the following form is displayed:
|
|
|||||||||||||||||||||||||||||||||||||||||||||||||||||||||||||||||||||||||||||||||||||
|
Toolbar Buttons |
Top of form controls | ||||||||||||||||||||||||||||||||||||||||||||||||||||||||||||||||||||||||||||||||||||
|
Select Polyline |
Initiates polyline selection from the drawing. Click to select a polyline; section updates automatically. Must select a valid polyline to generate section. | ||||||||||||||||||||||||||||||||||||||||||||||||||||||||||||||||||||||||||||||||||||
|
Refresh |
Rebuilds the section view with current settings. Use after making changes to source data or settings (Hotkey: F5). | ||||||||||||||||||||||||||||||||||||||||||||||||||||||||||||||||||||||||||||||||||||
|
Surface Selection |
Left panel, top section. Populated from project's surface list. | ||||||||||||||||||||||||||||||||||||||||||||||||||||||||||||||||||||||||||||||||||||
|
Include (Checkbox) |
Toggle surface visibility on/off. | ||||||||||||||||||||||||||||||||||||||||||||||||||||||||||||||||||||||||||||||||||||
|
Surface Name |
Identifies each available surface. | ||||||||||||||||||||||||||||||||||||||||||||||||||||||||||||||||||||||||||||||||||||
|
Colour Swatch |
Click to change the display colour for that surface. | ||||||||||||||||||||||||||||||||||||||||||||||||||||||||||||||||||||||||||||||||||||
|
Model Selection |
Left panel, middle section. Includes terrain models, road models, etc. | ||||||||||||||||||||||||||||||||||||||||||||||||||||||||||||||||||||||||||||||||||||
|
Include (Checkbox) |
Toggle model visibility on/off. | ||||||||||||||||||||||||||||||||||||||||||||||||||||||||||||||||||||||||||||||||||||
|
Model Name |
Identifies each available model. "TotalModel" represents combined data. | ||||||||||||||||||||||||||||||||||||||||||||||||||||||||||||||||||||||||||||||||||||
|
Colour Swatch |
Click to change the display colour for that model. | ||||||||||||||||||||||||||||||||||||||||||||||||||||||||||||||||||||||||||||||||||||
|
Sub-Model Selection |
Left panel, lower middle section. Hierarchical components loaded dynamically. | ||||||||||||||||||||||||||||||||||||||||||||||||||||||||||||||||||||||||||||||||||||
|
Include (Checkbox) |
Toggle sub-model visibility on/off. | ||||||||||||||||||||||||||||||||||||||||||||||||||||||||||||||||||||||||||||||||||||
|
Sub-Model Name |
Identifies each sub-model. | ||||||||||||||||||||||||||||||||||||||||||||||||||||||||||||||||||||||||||||||||||||
|
Colour Swatch |
Click to change the display colour for that sub-model. | ||||||||||||||||||||||||||||||||||||||||||||||||||||||||||||||||||||||||||||||||||||
|
Survey Settings |
Left panel, bottom section. Configure display of COGO points and survey strings. | ||||||||||||||||||||||||||||||||||||||||||||||||||||||||||||||||||||||||||||||||||||
|
Point Group |
Select which point group to display from available groups in the project. | ||||||||||||||||||||||||||||||||||||||||||||||||||||||||||||||||||||||||||||||||||||
|
Include Survey Strings |
Toggle display of connected survey strings from selected point group (Default: Checked). | ||||||||||||||||||||||||||||||||||||||||||||||||||||||||||||||||||||||||||||||||||||
|
Show COGO Points |
Toggle display of COGO points within tolerance as circles near the section line (Default: Checked). | ||||||||||||||||||||||||||||||||||||||||||||||||||||||||||||||||||||||||||||||||||||
|
Settings |
|
||||||||||||||||||||||||||||||||||||||||||||||||||||||||||||||||||||||||||||||||||||
|
Draw CAD Section |
Pick a location in the drawing to draw the section as CAD objects. | ||||||||||||||||||||||||||||||||||||||||||||||||||||||||||||||||||||||||||||||||||||
|
Show Grid |
Toggle grid overlay lines on the section view (Default: Checked). | ||||||||||||||||||||||||||||||||||||||||||||||||||||||||||||||||||||||||||||||||||||
|
Main 2D Viewer |
Centre panel. Interactive 2D visualisation. | ||||||||||||||||||||||||||||||||||||||||||||||||||||||||||||||||||||||||||||||||||||
|
Navigation Controls |
Pan: Middle mouse button + drag |
||||||||||||||||||||||||||||||||||||||||||||||||||||||||||||||||||||||||||||||||||||
|
Status Bar |
Bottom of form | ||||||||||||||||||||||||||||||||||||||||||||||||||||||||||||||||||||||||||||||||||||
|
Toggle Settings Panel |
Shows/hides the left settings panel (Arrow icon). | ||||||||||||||||||||||||||||||||||||||||||||||||||||||||||||||||||||||||||||||||||||
|
Offset Display |
Shows current mouse position along section line in project units. | ||||||||||||||||||||||||||||||||||||||||||||||||||||||||||||||||||||||||||||||||||||
|
Elevation Display |
Shows elevation at current mouse position in project units. | ||||||||||||||||||||||||||||||||||||||||||||||||||||||||||||||||||||||||||||||||||||
|
OK |
Closes the Quick Section viewer. | ||||||||||||||||||||||||||||||||||||||||||||||||||||||||||||||||||||||||||||||||||||
|
Cancel |
Closes the Quick Section viewer. |
||||||||||||||||||||||||||||||||||||||||||||||||||||||||||||||||||||||||||||||||||||